


Why audiograms are used
The audiogram was developed before 1940 as a tool to measure a person’s hearing loss. The audiogram measures an individual’s responses when they just hear sounds at various frequencies. The results show how much hearing loss a person has in each ear.
Following World Wars I and II, it became important for doctors to determine whether an individual had a hearing loss to determine if they qualified for the draft and later to determine whether they suffered hearing loss due to noise exposure while serving in the military.
One of the goals for measuring hearing is to determine how well a person can hear the speech to be able to communicate with others. The specific frequencies tested on an audiogram fall into the range of the phonetic language. That’s why, while undergoing a comprehensive hearing test, word tests are included.
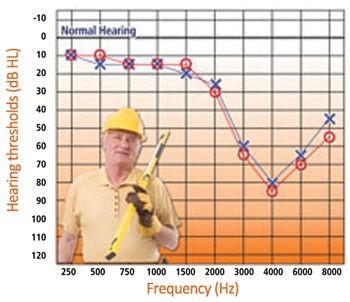
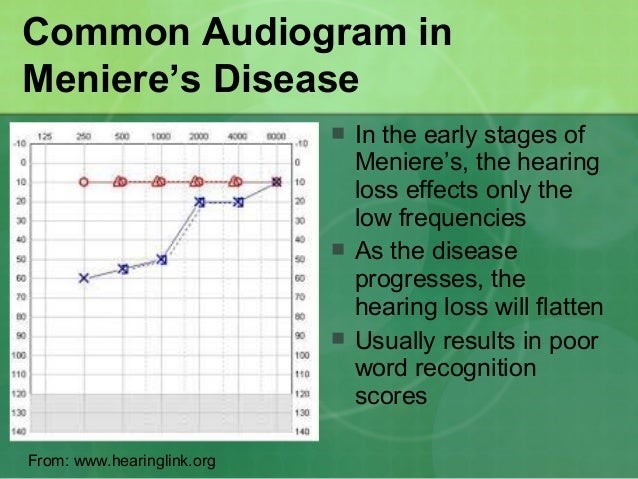
Not only does the audiogram track hearing loss levels, but it can also be used in diagnosing different causes of hearing loss. Below are two audiograms showing various types of hearing loss with different diagnoses:
Noise-induced hearing loss in both ears Left Meniere’s disease with normal right ear hearing
Reading an audiogram
The audiogram measures a person’s ability to hear different sound levels at multiple frequencies. The Y-axis of the graph represents intensity levels (loudness), and the X-axis represents frequencies (pitch range). The X-axis progresses left to right, from low pitch to high pitch, like the keys of a piano. The Y-axis progresses from top to bottom, extremely soft to very loud, respectively, like from the sound of a pin drop to a jet engine roar.
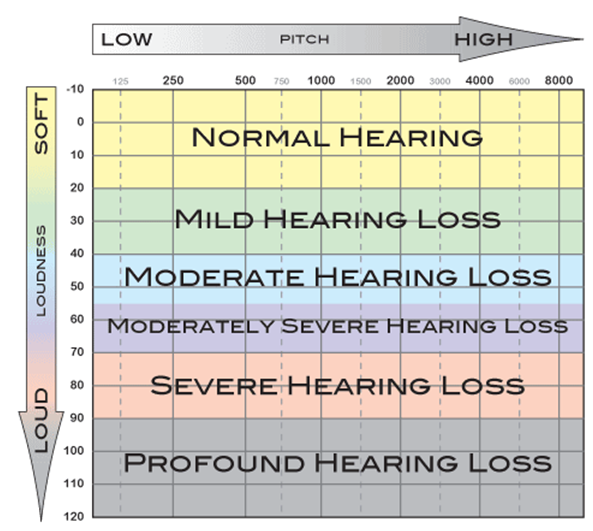
How bad is my hearing?
People with hearing loss have thresholds exceeding the standard range for normal hearing. There are varying degrees of hearing loss:
Slight hearing loss: 16-25 dB higher than normal
Mild hearing loss: 26 to 40 dB higher than normal
Moderate hearing loss: 41 to 55 dB higher than normal
Moderate-to-severe hearing loss: 56 to 70 dB higher than normal
Severe hearing loss: 71 to 90 dB higher than normal
Profound loss: greater than 90 dB
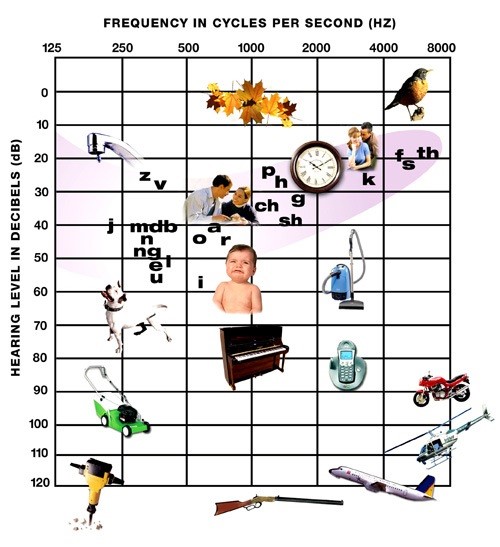
A graph containing typical everyday sounds overlaid onto an audiogram can help put the hearing loss in perspective. In comparison to a high-frequency hearing loss, a person with a slightly low-frequency hearing loss may hear a clock ticking or the refrigerator motor turning on, but they won’t hear birds chirping or a cellphone ringing.
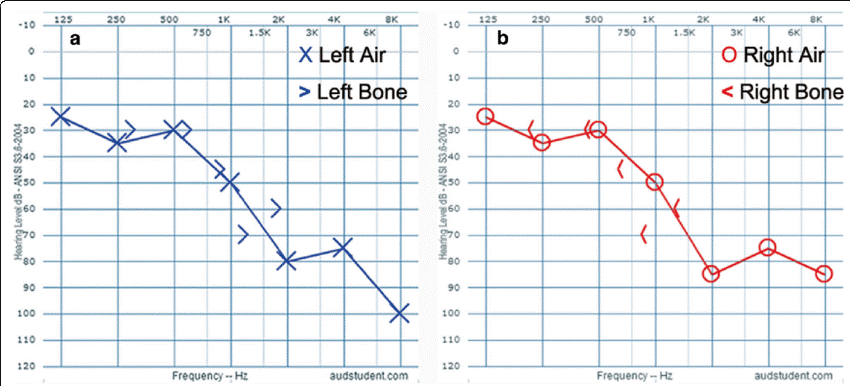
The audiogram below shows a common pattern of age-related hearing loss. The red circles represent the right ear, and the blue X’s represent the left ear.
Can you determine the degree of hearing loss in each ear?
Next steps to take
If you are experiencing difficulty in hearing, especially when in groups or in background noise, it’s important to find out whether or not you have a hearing loss.
Some common causes of hearing loss include earwax buildup in the ear canal or an ear infection in the middle ear. This type of hearing loss is called conductive hearing loss because the pathway that ‘conducts sound’ to the inner ear is blocked. Once the earwax is removed or the ear infection clears, it’s possible that the hearing loss will resolve. However, not all conductive hearing losses are temporary. Some are permanent and require a hearing aid for improved hearing.
Another type of hearing loss is sensorineural hearing loss. This type of hearing loss results from damage to the hair cells of the inner ear. Sensorineural hearing loss is considered permanent and does not get better from ear cleanings or infection clearing. That’s because the hair cells are permanently damaged. Some common causes of sensorineural hearing loss are noise-induced hearing loss (resulting from consistent exposure to loud noise) and presbycusis (hearing loss from aging).
What kind of hearing loss do you have?
Submit your audiogram for a complimentary consultation with our audiologist.
Photo credits:
https://i.pinimg.com/736x/ac/05/79/ac0579a1917b9f695495805c367328a5.jpg
https://www.nationalhearingtest.org/wordpress/?p=786
Answer Key:
Left: Slight to profound hearing loss.
Right: Slight to severe hearing loss.